If you are a security specialist, then you will need to analyze hosts frequently if suspicious activity is noticed. To stay undetected for longer, attackers often use legitimate tools and processes that can be found in any Microsoft Windows operating system.
Therefore, it is important to understand how Windows handles processes and what built-in tools a security professional can use to analyze activities on a host.
Processes, Threads, and Services
On Windows, when an application is running, it creates a process. Typically, an application can have one or more processes dedicated to it. Each process provides the resources needed to execute/run a program on the host operating system. Imagine that you are opening Task Manager to check your computer’s performance. The operating system will create a process with all the necessary resources for this application.
The following figure shows the current processes on a Windows OS: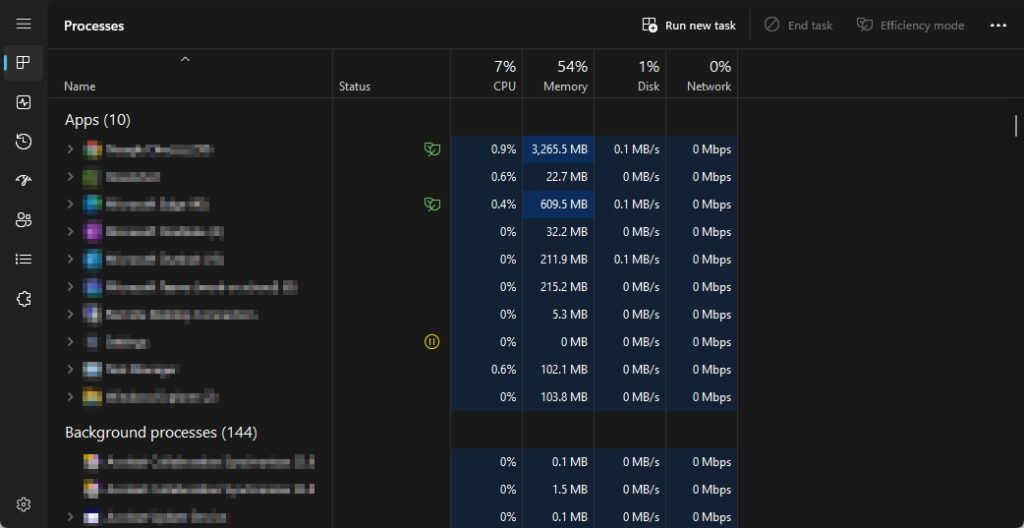
As shown in the previous figure, Task Manager is a utility that provides information about the processes, services, and performance of a device. On the Processes tab, you will see a list of all currently running applications on the host operating system, a list of background processes, and the resources that are allocated to each application (CPU, Memory).
Background processes in Windows run as services. A service is a program that runs in the background of an operating system, providing support for an application and/or operating system. These services can be configured to start automatically when Windows boots. You can start, stop and restart the service manually.
The following fugure shows the Services Control Panel window on the Windows OS: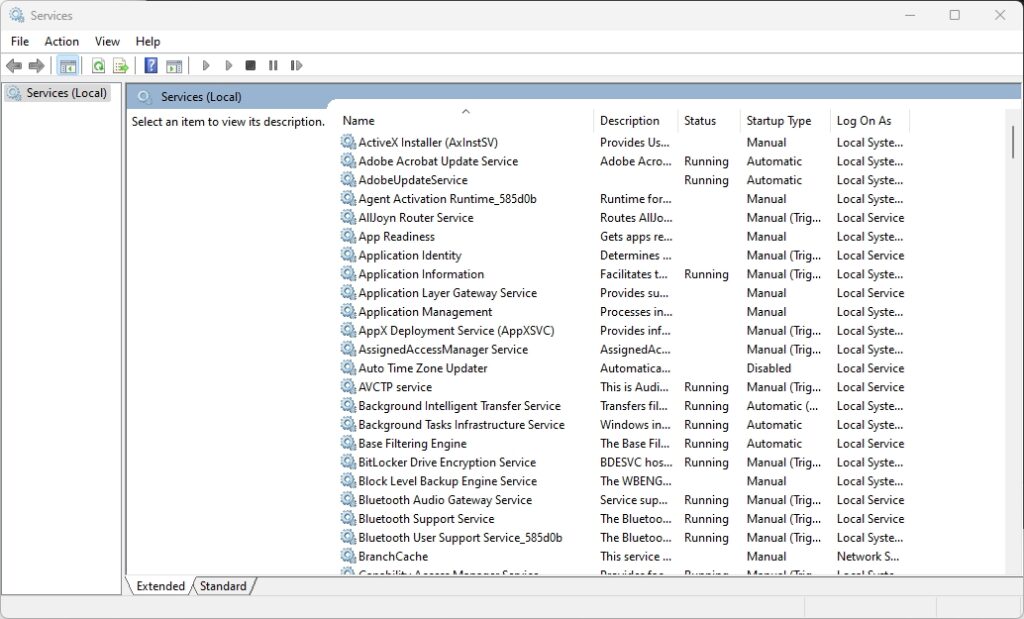
The previous figure shows a list of services on the host operating system. Here you can set the properties of the service in Windows. Double-clicking on the service will open the properties window.
The following figure shows the properties window of a service: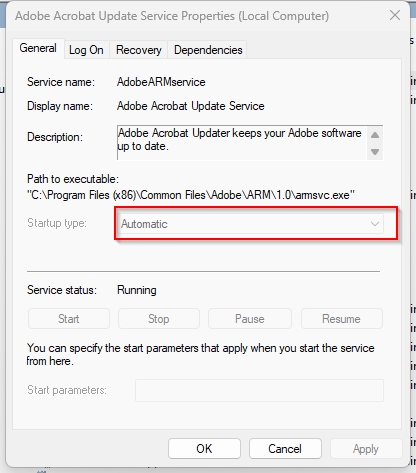
As shown in the previous figure, you can customize the startup type of the service.
Each application creates a parent process with one or more child processes, sometimes called a thread. Each child process or thread is responsible for a function that runs the application. When an application is running on Microsoft Windows operating systems, the parent process uses the fork() system call, which allows the parent process for a running application to create one or more child processes. However, keep in mind that a child process can only have one parent process, and a parent process can have multiple child processes.
When an application is executed by the operating system or by the user, the operating system uses physical memory from the main memory and creates virtual memory to allocate to a running process or child process. Thus, processes run in the virtual address space of the operating system.
Important note! The Windows operating system manages the allocation of virtual memory to a process.
Sometimes when an application closes, the parent process, and all child processes exit, thus releasing resources back to the operating system. However, the parent process can be terminated while the child processes remain active. In this situation, virtual memory and any other resources are still allocated to each child process. A child process that does not have a parent process is called an orphan process. The user can manually end the child process in Task Manager or reboot the system. Rebooting the system will end all processes and restart the operating system.
The following image shows a list of all running processes on the Details tab in the Task Manager: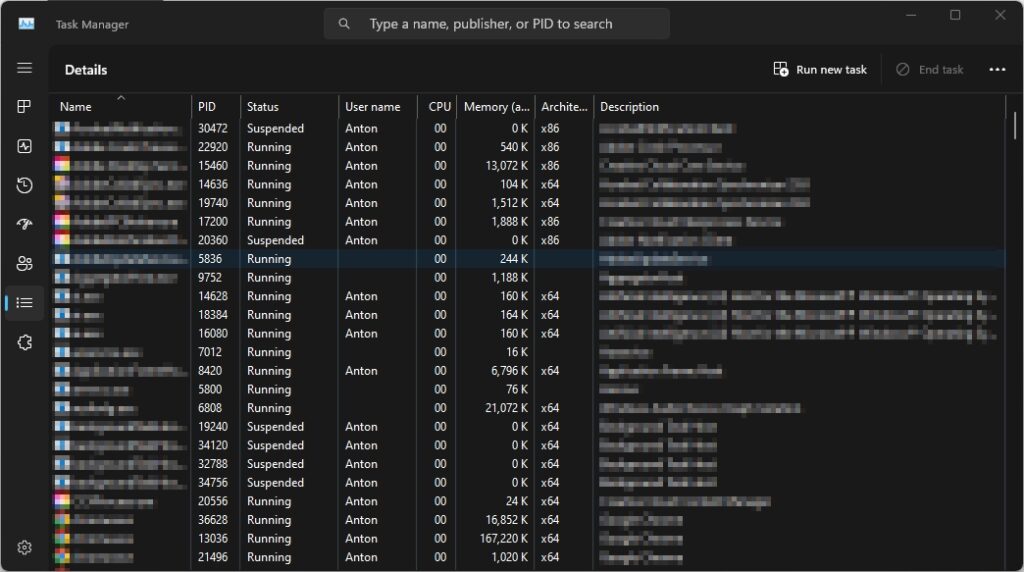
As shown in the previous screenshot, we can see all processes, the process id (PID) for each process, the status, which user is running the process, and resource allocation. Also available in Microsoft Windows is the Resource Monitor utility. The Resource Monitor provides more detailed information about all processes and how they use the CPU, disk memory, and network on the device.
The following figure shows the Resource Monitor interface on a Windows OS: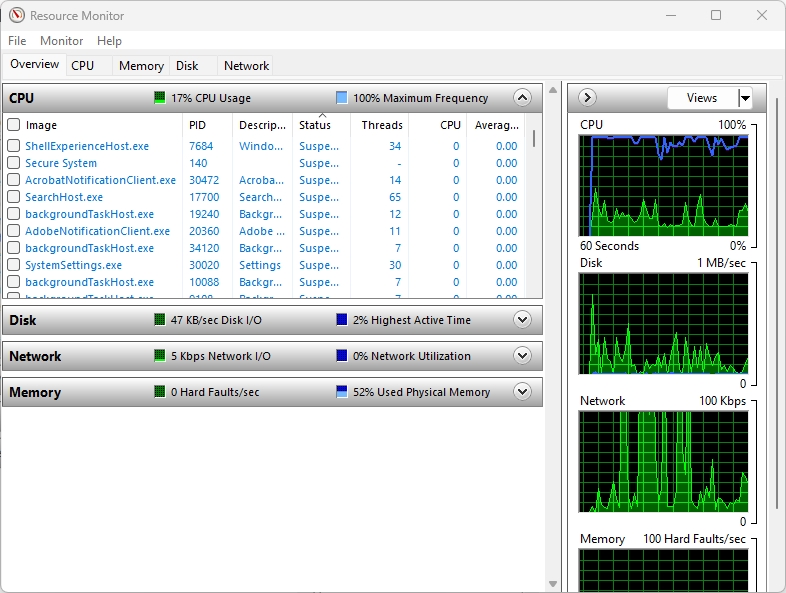
Another tool to help you determine the address space and memory allocation in Microsoft Windows is the RAMMap tool, which is part of Microsoft’s Windows Sysinternals toolkit.
The following figure shows the summary list and page list on a host using RAMMap: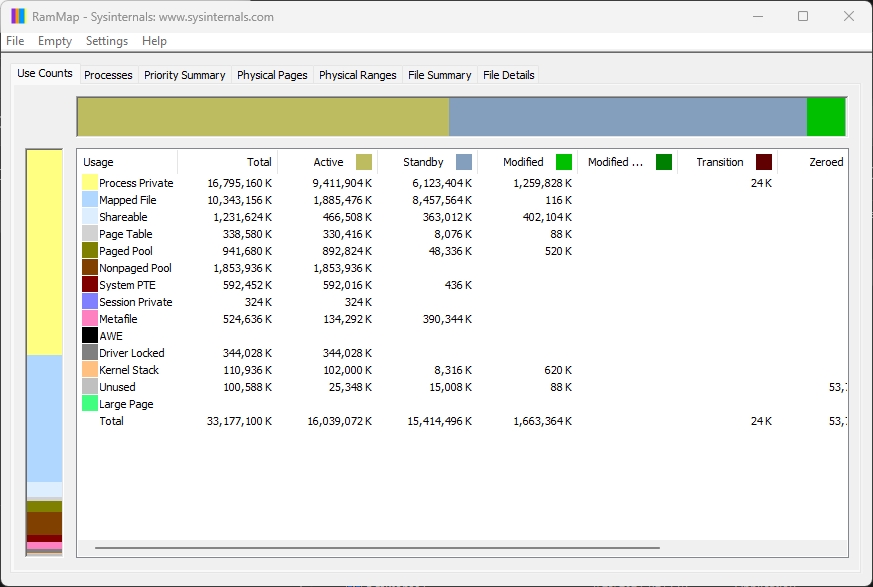
As shown in the previous screenshot, RAMMap shows a summary of virtual memory allocation and usage. In addition, the Processes tab contains a complete list of all processes:
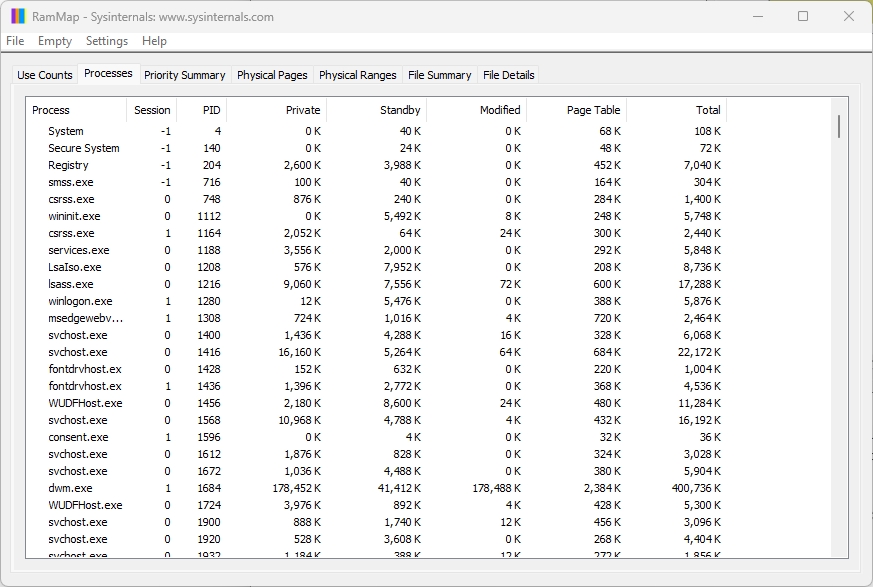
As shown in the previous figure, in this tab you can see each running process and virtual memory allocation. This tool is really useful for demonstrating how your operating system allocates physical memory and how much memory is being used as a cache for data on the device.
Paging file size in Windows
As more applications are loaded into memory, the operating system allocates portions of physical memory (RAM) to each process using virtual memory. Each parent process and its child processes run in the same virtual address space on the host operating system. As already mentioned, the operating system is responsible for allocating memory, however, there are some applications that require much more memory than others to run smoothly, and this can create a shortage of available memory for other applications.
The Windows operating system utilizes some of the memory from another area, from a hard drive or SSD. Windows takes a small amount of memory from the local disk and converts it to virtual memory. This is called the paging file.
The page file allows the host operating system to use this portion of memory to load applications and therefore reduces the load on physical memory (RAM) in the system.
To access paging file settings, follow these steps:Right Click the Windows icon in the lower left corner of the screen and select System. The System window will open. Select “Advanced system settings” on the right. The System Properties window opens. Select “Advanced” and click “Settings” under “Performance” as shown below:
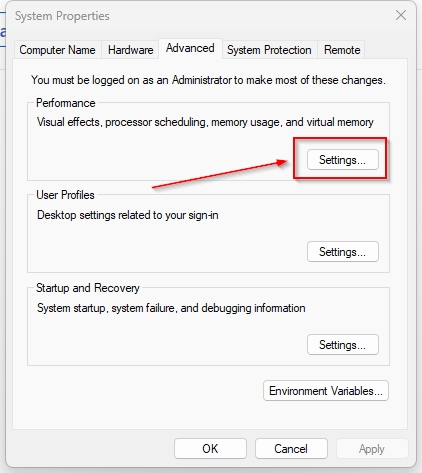
The performance settings window will open. To change the paging file size, click “Change…“:
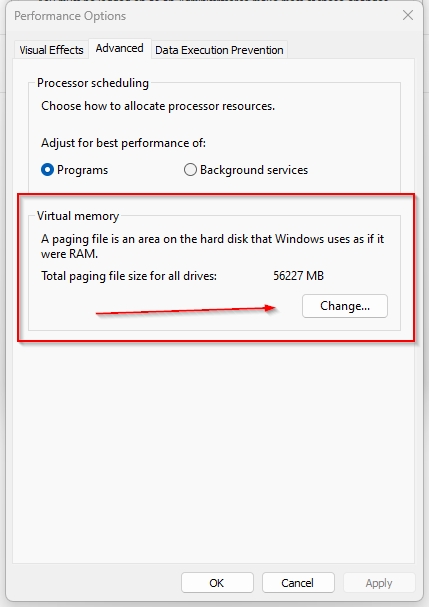
You will be given the option to adjust the paging file size for all drives on the local system. The default paging file size depends on the amount of RAM on the host system. The Windows 11 operating system automatically manages the size of the paging file based on the host configuration and the amount of RAM in the system.
Windows uses the paging file as virtual memory in case there is not enough physical memory in RAM.
Windows Registry
All information about the configurations and settings of the Windows operating system and its users is stored in a database known as the registry. The highest level of the registry is known as the hive. There are five hives in the Windows registry, and each data value is stored in a section or subsection of the hive. A registry tree (hive) is a subset of registry keys, subkeys, and settings associated with a set of auxiliary files that contain backup copies of this data. The term branch is often used to refer to specific paths in the registry. For example, the HKEY_LOCAL_MACHINE\SYSTEM registry branch.
The five hives and their functions in Windows are listed below:
- HKEY_CLASSES_ROOT – It contains information about file extensions that are used by the programs installed on the system for the purpose of file associations, and other things. Because of the settings stored in this Hive, Windows recognises which file type to play with which software.
- HKEY_CURRENT_USER – It contains settings only about the currently logged-in user. Each time a user logs into the computer, his profile is loaded in this Hive from the HKEY_USERS Hive, which has profiles/keys for all of the users created on the system.
- HKEY_LOCAL_MACHINE – It also contains all kinds of Hardware and Software related information about the system. It contains settings that are general to all of the users created on the system.
- HKEY_USERS – It contains information about and preferences of all of the users that log on to the system. It has one key for each user created on the system.
- HKEY_CURRENT_CONFIG – It contains all the information about the Hardware currently in use.
To access the registry, use the Registry Editor (regedit) in the Windows search bar.
The following figure shows the Windows Registry Editor:
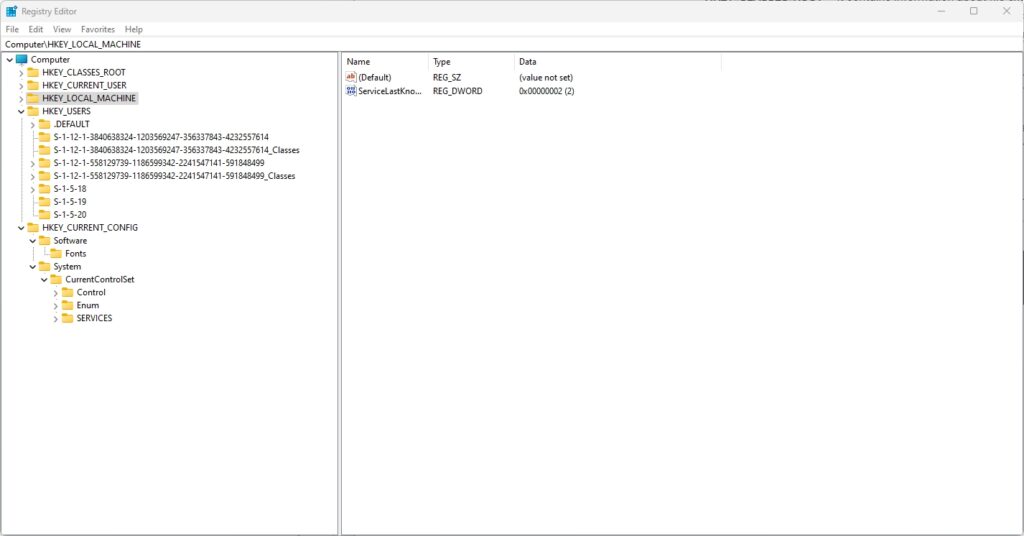
As shown in the previous picture, you can see that each hive is at the top of its level. If you expand the hive, you will see folders, and each folder has keys that contain information about a particular feature or configuration in the operating system.
The registry can provide valuable information during an investigation. Each registry has a value known as LastWrite, which simply indicates the last time an object or file was modified. This information can be used to determine the timing of a security incident or event. The registry also contains information about applications that start automatically with system startup – AutoRun. To gain a foothold in the system, attackers often modify the registry branches that are responsible for automatically starting processes and services and add links to malicious programs so that they start every time the system starts and can survive a reboot.
Below are the main branches responsible for the automatic start of applications and services:- [HKEY_LOCAL_MACHINE\Software\Microsoft\Windows\CurrentVersion\RunOnce]
- [HKEY_LOCAL_MACHINE\Software\Microsoft\Windows\CurrentVersion\Run]
- [HKEY_LOCAL_MACHINE\Software\Microsoft\Windows\CurrentVersion\RunServices]
- [HKEY_LOCAL_MACHINE\Software\Microsoft\Windows\CurrentVersion\RunServicesOnce]
- [HKEY_LOCAL_MACHINE\Software\Microsoft\Windows NT\CurrentVersion\Winlogon\Userinit]
- [HKEY_CURRENT_USER\Software\Microsoft\Windows\CurrentVersion\Run]
- [HKEY_CURRENT_USER\Software\Microsoft\Windows\CurrentVersion\RunOnce]
- [HKEY_CURRENT_USER\Software\Microsoft\Windows\CurrentVersion\RunServices]
- [HKEY_CURRENT_USER\Software\Microsoft\Windows\CurrentVersion\RunServicesOnce]
- [HKEY_CURRENT_USER\Software\Microsoft\Windows NT\CurrentVersion\Windows]
For example, to launch notepad every time Windows starts, you can add a new value to the [HKEY_CURRENT_USER\Software\Microsoft\Windows\CurrentVersion\Run] branch and specify a link to the executable file on the computer in it – “Notepad”=”c:\windows\ notepad.exe”
Windows Management Instrumentation
Managing multiple Windows computers on a small network is easy. However, as the network grows, more and more Windows-based devices are being connected, managing application-level policies and services can become challenging. Windows Management Instrumentation (WMI) is a tool built into the Windows operating system that allows a system administrator or security professional to manage many Windows-based systems on a corporate network.
WMI is a Windows administration feature that provides a single environment for local and remote access to Windows system components and also allows you to collect statistical information about remote computers on your network. You will be able to collect statistics on both hardware and software, and even monitor the status of each device.
To open WMI on a Windows computer, follow these steps:- Open the Computer Management app in Windows 11 or Server 2022.
- On the left, expand Services and Applications.
- Right-click the WMI control and select Properties.
The following figure shows the properties interface of the WMI control:
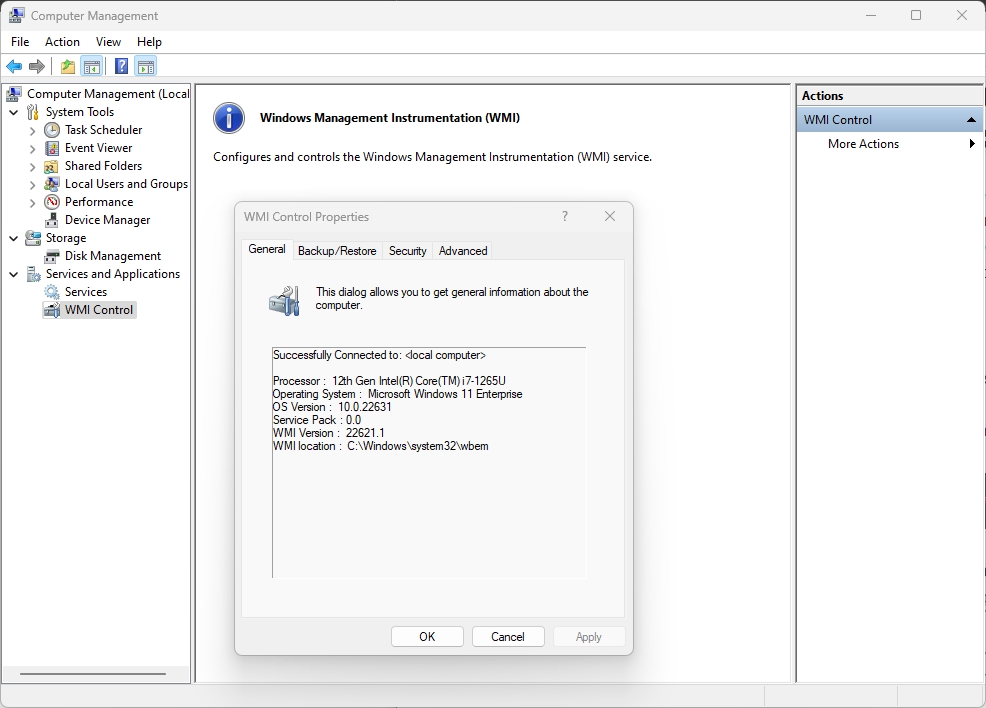
Attackers can use Windows Management Instrumentation (WMI) for remote control. WMI works through the SMB protocols and Remote Procedure Call Service (RPCS) for remote access. RPCS works on port 135.
WMI is managed through the WMI command-line (WMIC) command line utility. An example command is – wmic process call create.
The use of WMI should be restricted to authorized users only, and closely monitored its use.
Monitoring Tools
In the Windows operating system, there are many monitoring tools that a security professional can use to monitor various resources and activities on a device. One such tool is Performance Monitor, which allows the user to collect more detailed data than the previously mentioned Resource Monitor. Performance Monitor (Performance Monitor) is the main tool used in both Windows 11 and Windows Server. A security professional can use this tool to collect statistics about a system over various time periods, such as hours or days. The collected data can then be analyzed for any anomalies.
The following figure shows the performance monitor on a Windows 11/Server 2022 system: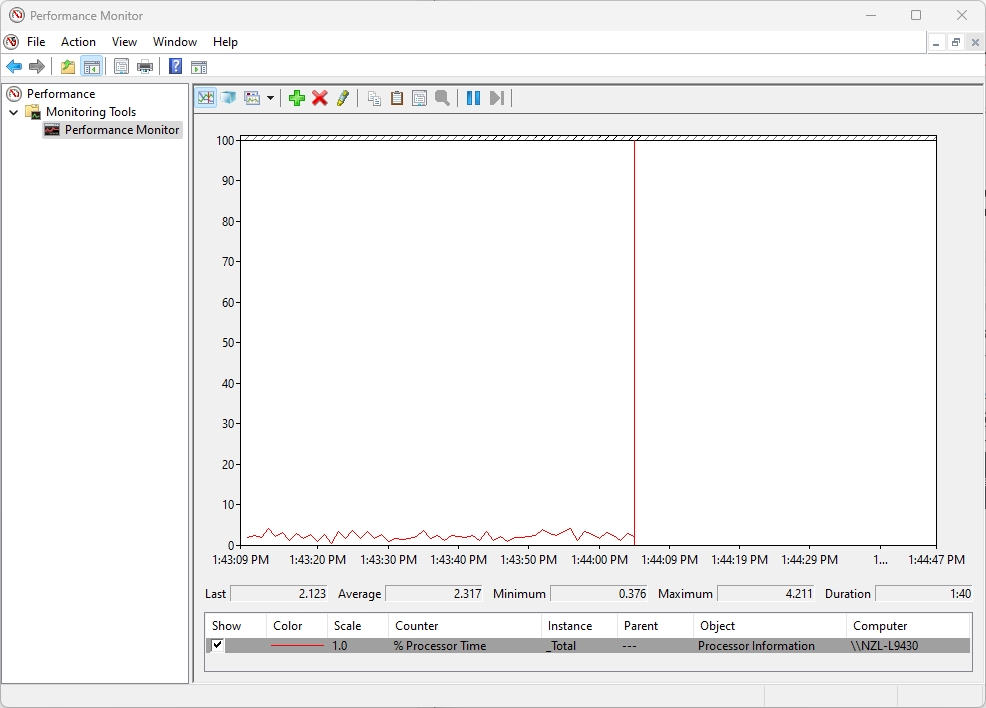
Another great tool built into Windows is System Reliability Monitor. The System Reliability Monitor allows a security professional to view a history of issues that have occurred on a primary system over days or weeks. The user can click on an event in the tool to get detailed information about the problem, and there is a rating system from 1 to 10 that reflects the severity of the problem.
Press the Win + R keys on your keyboard, type perfmon /rel into the Run window and press Enter.
The following figure shows System Reliability Monitor on a Windows computer: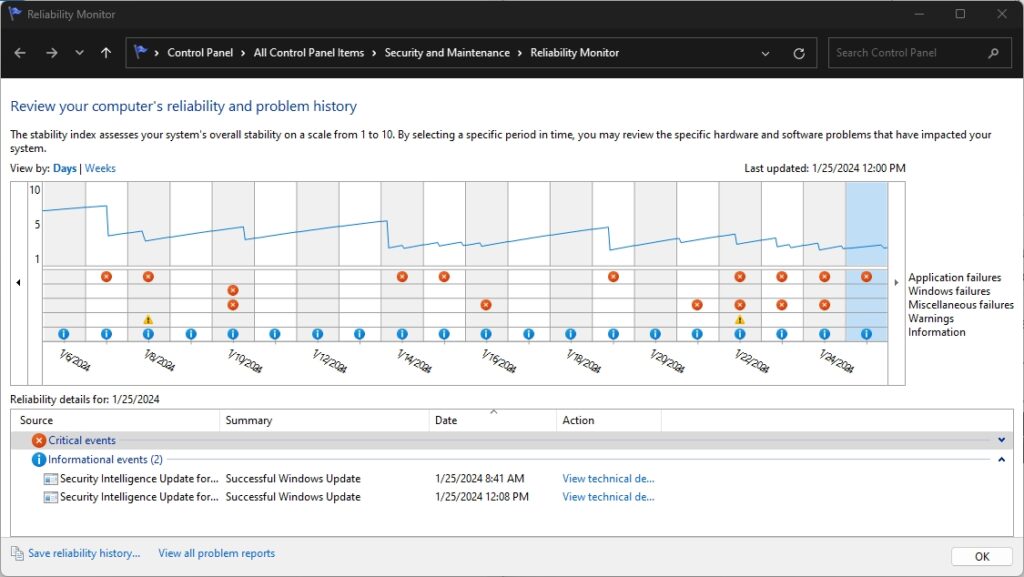
As shown in the previous figure, the system has experienced a number of critical events over a period of time. When you select an event, the monitor will display detailed information about the service or application that raised the event, a summary, and when it occurred. A security professional can use the statistics and information found here to better understand whether malware or unauthorized applications have caused a security breach on a host system.
Event Viewer
When an event occurs on a Windows system, a log message is generated for that event. A tool that allows you to analyze event data called Event Viewer. The Event Viewer contains security, application, and system event logs.
Imagine that an attacker is trying to log in to a user account with incorrect credentials. For each attempt, a log message event will be generated and the attack can be detected from this data. There are 4 main event logs:
- Security – stores security events
- Application – stores application logs in the system and installed software
- Setup – stores information about the installation of the OS
- System – stores information about the operation of the system itself
The following figure shows the Windows Event Viewer: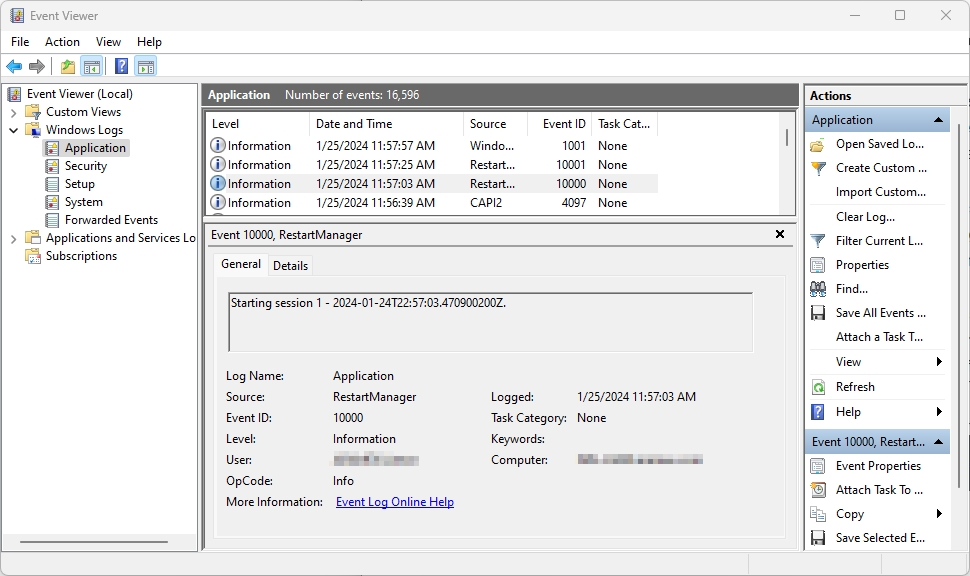
If you expand a category such as Security, you will see a list of all security-related logs. The following screenshot shows the details in the Security Logon Event Viewer:
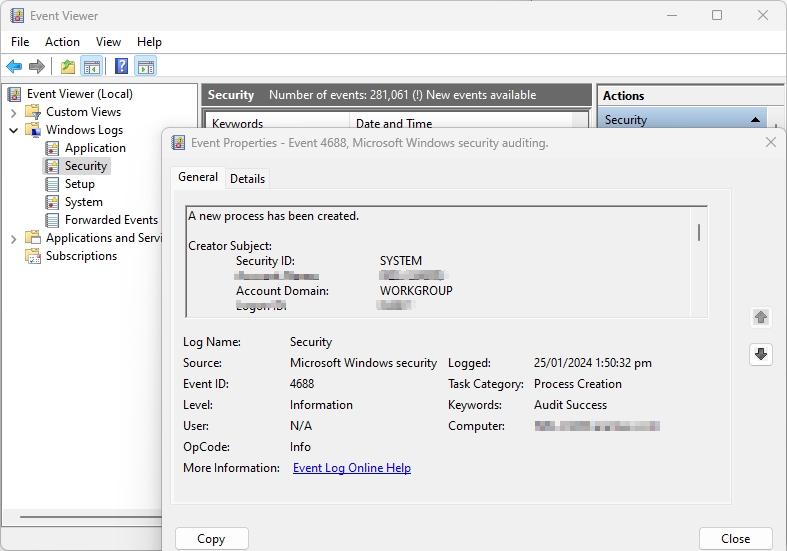
The information contained in the log messages helps the security professional determine what, when, and how an incident occurred on the system.
Pay attention to the event code – 4624. This code corresponds to a successful logon to the Windows system. If the login is unsuccessful, event ID 4625 will be generated. These events will also contain other useful information, such as: the name of the user who is logging in, information about the system from which the login is performed, type of login (interactive, remote, network, service login), process login, login ID and more.
Other important event IDs on Windows systems stored in the Security log:
4725 – Disable Account
4723 – Changing account password
4724 – Account password reset
4720\4726 – Creating/deleting a user
4648 – Login with explicit credentials
4698 – Creating a task through the task scheduler
4697 – Creating a service in the system
4688\4689 – Create/End Process

